Introduction
Images can be mined for further information, or enhanced to illustrate a point. Tools on image viewers can provide a simple way to change brightness contract and tint. However, for more complicated analysis and processing, you will need more advanced tools. An example involving color processing is shown below.
Spectrum
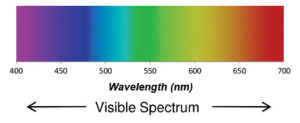
First, we not that light is broken down into a wide range of colors, each of which comprises photons of a visible wavelength. Note that the human eye sometimes interprets photons in ways that do not directly represent the photons. For example, when both green and red photons strike the eye, the brain interprets such as yellow, even though the photons themselves remain distinct.
Spectrum wavelengths
CCD with filters
Most commercial cameras contain a CCD cameras that detects phones. Color CCDs are covered with many tiny red, green and blue filters to separate those colors. Such a CCD will output the light that falls through each color of filter as a separate color channel.
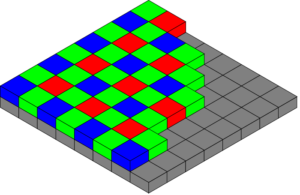
Built-in filters on a typical CCD
Python
Image processing software can be expensive, and might not have the desired customizations. It is not difficult to write an image-processing program in Python, a programming language for which there are many libraries (snippets of pre-written code) that extend Python’s functionality. A good library for images is PIL (Python Imaging Library).
Task
We want to enhance an image of Ghent to make paved and built-up areas more distinct.
We can use this Python code for an image processor for Ghent. It imports the PIL library, extracts size and format data for the desired image. It then pulls the data from the red and blue channels, adds them together, and creates a resulting monochrome image.
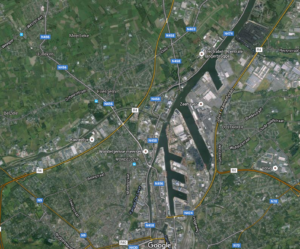
Original image
In an original full-color image of Ghent, streets are often hard to distinguish from wooded areas.
Monochrome from Red + Blue channels
If we take the output from the red and blue channels (but not the green), the built-up areas and roads show up as bright areas against darker gray regions.

Monochrome Ghent from Red + Blue. Original image: Google. Altered image: Mark Ciotola
Going Further
We just worked with the three colors available from a color CCD. This limits what can be identified. There is a technology called hyperspectral imaging that can separate over 100 colors and even produce spectral images. Hyperspectral image data can be used to provide a spectral plot for each pixel that can then be used to identify specific chemical elements.

Spectral plot
…